-

Despite a 14% increase in the S&P 500 index in 2023, markets continue to be volatile. In this article, our team highlights the main technical factors that may affect the growth of the stock market in the 4th quarter of 2023 and for the whole of 2024.
First of all, based on the analysis of inflationary trends, we believe that inflation in the United States may decrease to 3% by the beginning of 2024. Secondly, the 4th quarter of 2023 and 2024 may be favorable for the stock market due to the effect of seasonality, as well as due to the fact that we are approaching the last year of the US presidential cycle. Thirdly, based on our internal model, the fair value of the S&P 500 index, all other things being equal, is 4,600 (the value at the date of publication of the article is 4,370), which implies a growth potential of +5%. In conclusion, the positioning of commercial players, which are considered to be smart money, remains positive, in other words, commercial traders expect that the markets still have growth potential.Inflation in the United States may decrease to 3% by early 2024.
One of the main factors of the high current inflation rate is the increase in rental prices, which in September amounted to +7.2% year-on-year. The methodology for calculating rental inflation is lagging, and if we take into account the trend in rental inflation from the popular real estate website Zillow, which monitors prices in real time, we can see that rental housing in the United States has been growing in the range of 3.0-3.5% in annual terms over the past 3 months. Based on this and the dynamics of the other components of the CPI, inflation in the United States may continue to decline in the coming months and reach 3% by early 2024.
Lower inflation will allow the US Federal Reserve to begin easing monetary policy. So, based on the Fed's forecasts, the US Federal Reserve will begin to reduce the base rate at the end of 2024 to 5.1%, and in 2025 the rate may decrease to 3.9%.Seasonality and the US presidential cycle are favorable for the stock market.
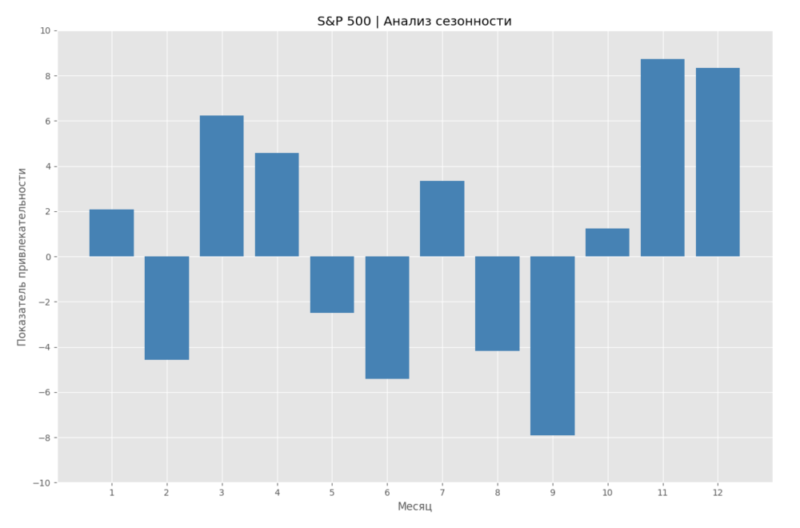
From 1945 to 2023, the best quarter for the growth of the S&P 500 index was the 4th quarter. Thus, the average return in the 4th quarter was +4.1%, while in the 1st, 2nd and 3rd quarters the average return was +2.0%, +2.0% and +0.4%, respectively. We have analyzed the dynamics of each month for the S&P 500 since 1945, and in the graph below we present an indicator (from -10 to +10) of the attractiveness of each month for the index. November and December have been the most attractive months for the S&P 500 since 1945.
Also, since 1945, we have studied the dynamics of the S&P 500 index depending on the year of the presidential cycle. We found that in the 4th year of the presidential cycle, the S&P 500 index averaged +8.5% growth, while in the 1st, 2nd and 3rd years of the presidential cycle, the average return was +3.0%, +3.4%, +14.1%. As we enter the last year of the presidential cycle in 2024, we believe it is in the interests of the current U.S. government to create favorable conditions for stock market growth.
Our internal model indicates that the S&P 500 index, all other things being equal, may grow by +5%.
Based on the principles of Relative Value and Mean Reversal, we have created an indicator of the attractiveness of the S&P 500 index relative to the 10-year US government securities and the VIX fear index. The indicator indicates that the S&P 500 index remains undervalued by 5%. The chart below shows the dynamics of the S&P 500 in logarithmic format. In the second graph below, the periods of attractiveness of the S&P 500 index are shown in green, and the periods when the model considered the S&P 500 index overvalued relative to the 10-year US government securities and the VIX fear index are highlighted in red.
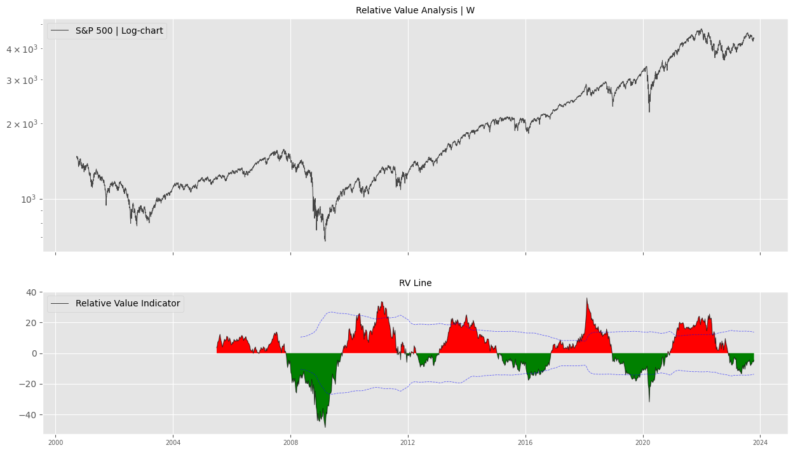
It is worth noting that this indicator is an auxiliary tool that should be used in addition to other technical and fundamental indicators.
The positioning of commercial players remains positive. Thus, smart money continues to believe that the S&P 500 index is attractive in the medium term.
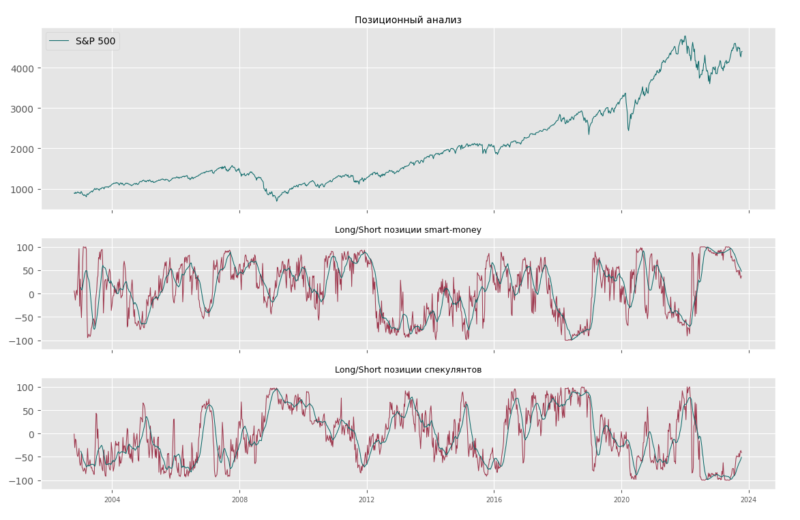
Commercial traders, who, unlike speculative players, are considered to be smart money, still have long positions in the S&P 500 index. Based on the data from the CME exchange and our calculations, the positioning level of commercial traders is +40%. This indicator ranges from -100% to +100%. Positive values mean that players have long positions in the S&P 500 index, and the higher the value, the larger the size of long positions. Accordingly, negative values imply short positions. The chart below shows an analysis of the positioning of commercial and speculative players.
What are the risks for the stock market?
In conclusion, we would like to draw attention to the risks present for the stock market. The main risk for the stock market is a more sustained high inflation and a longer hold on the base rate of the US Federal Reserve at a high level. Inflation may turn out to be stable due to the fact that the labor market remains strong and incoming macroeconomic data are inflationary. In addition, there remain geopolitical risks, namely the war in Ukraine, the conflict in the Middle East and the risks of China's invasion of Taiwan, which, if implemented, may negatively affect inflationary trends, global economic growth and investor appetite for risky assets.
The conflict in the Middle East between Israel and Palestine is most relevant at the moment. If this conflict develops into a larger war and involves other countries such as Iran and the United States, it could lead to a number of problems such as supply chain disruptions, strong price increases for energy products, renewed inflation and capital outflows from risky assets.

0 %
Leave your contact details and we will get back to you
Fill out the form and our manager will contact you and answer your questions
Your name
Your phone
Your email
Message
Attach file